Re-cap of Past Week trading trend
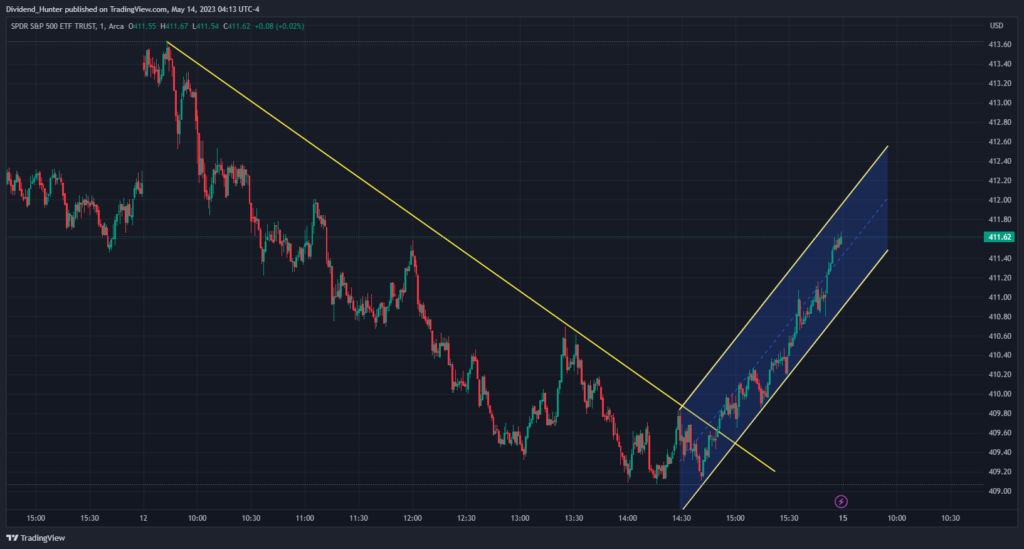
Here is a quick recap of what happened last Friday. We have an extended downward selling pressure. Observe that there is controlled buying up for scalpers in these selling pressures.
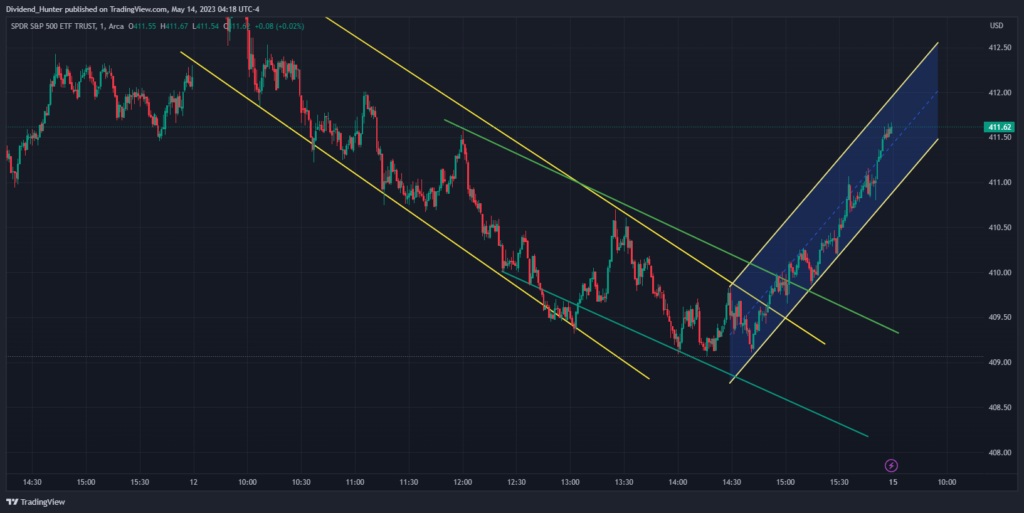
However, we also saw a tapering effect. What does it mean? Compare the selling pressure lines in yellow with the ones in green. You can observe that the ones in green are those that are gentler. This means that the selling pressure while around has started to reduce in “power”. While sellers are still in control, there are almost certain to be taken over by buyers.

So from 10.36 pm to 10.55 pm, we saw some signs of formation and informed our friends in the Pika World (free channel). That is to show that the charts are showing us structures that imply possible new formation..
Our Price Action Trades
Congrats to those who had taken advantage of the trades in the premium chat. It would have covered your monthly subscription, and way exceeds that.


Above are some trades we have taken, and some have expired, while others, we closed it nearing the end of the day as it is the earning season; we did not want to be subject to random swings that may cause our trade failures.
However, to give a heads-up. We do not issue calls but rather help our friends to analyse the possible market pulse and sentiment so that, over time, they can see price action clearly. That is why we do not show our trades and note that we are NOT always profitable. Sometimes I forsake some trade to faster draw the graphs to show you guys, so pardon the ugly drawing.
So what is next for the week ahead?
There are 4 broad ideas we wish to highlight.
#1: For the past week, the market is always trying to recover to MA5 and MA20 in closing.
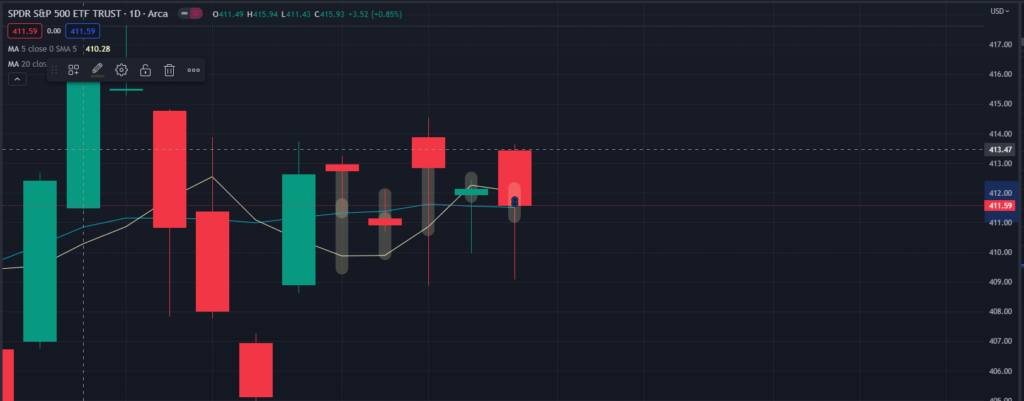
The yellow line is the MA5, and the green line is the MA20. For the week, the market has been often in this trend. If the day begins red, there is controlled selling and tapering towards the end. If the day begins green, there is controlled buying and tapering towards the end.
So we could keep a look out if this trend continues to play out during the upcoming trading week.
#2: Whenever the market pushes down, it tends to gravitate towards the orange line since Oct 2022.

So what is this orange line? Let us zoom out a bit; you can see that it is the uptrend line since October 2022.
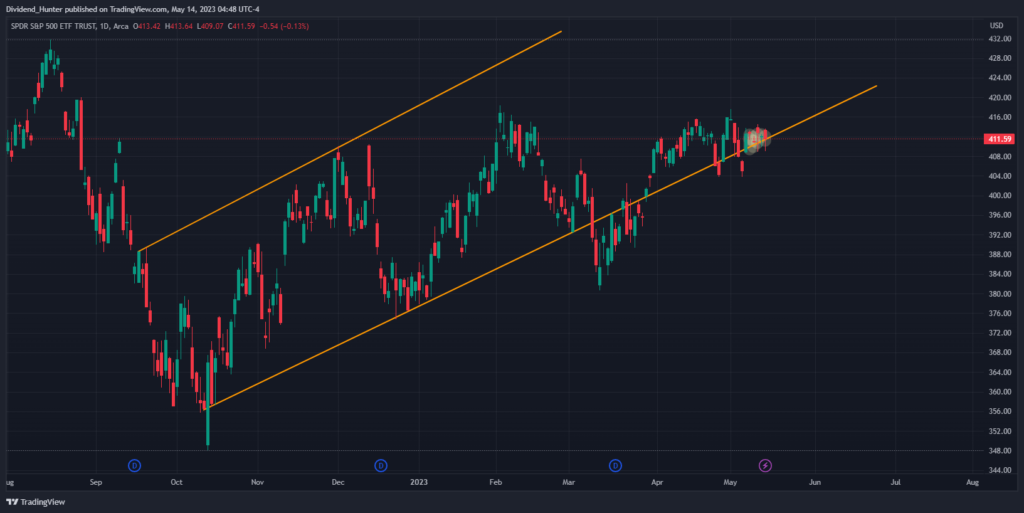
So it is clear that there has been a very clear buying algo since Oct 2022.
Are we, therefore, very bullish on the uptrend? Not really, because, on this large scale, we are also seeing some level of tapering. We had discussed this before. Let me refresh over here.
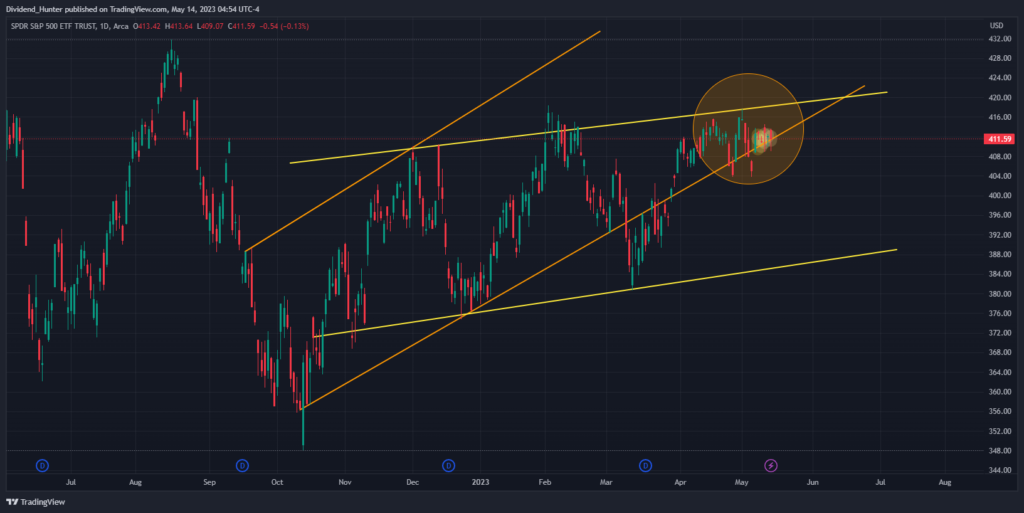
a) Observe the lines in orange and yellow. We can see that the ones in yellow are gentler, or what we always call “tapering” in this channel. Hence, there is somewhat of a weakening in the buying strength. We are keeping that in the rear of our minds.
b) In the circle zone highlighted in the chart, we are also stuck in the wedge between the yellow and orange lines. So technically, we are trapped in these 2 algo lines. Because of that, I have also pointed out that there is hope that we can even test the 420 level, which is at the upper range of the yellow line. This is shared in last week’s market update post. Here, is the link: https://moneynmeaning.com/2023/05/market-update-for-the-week-of-8-may/ if you need to re-cap.
#3: 408 appeared to be the next strong support line.
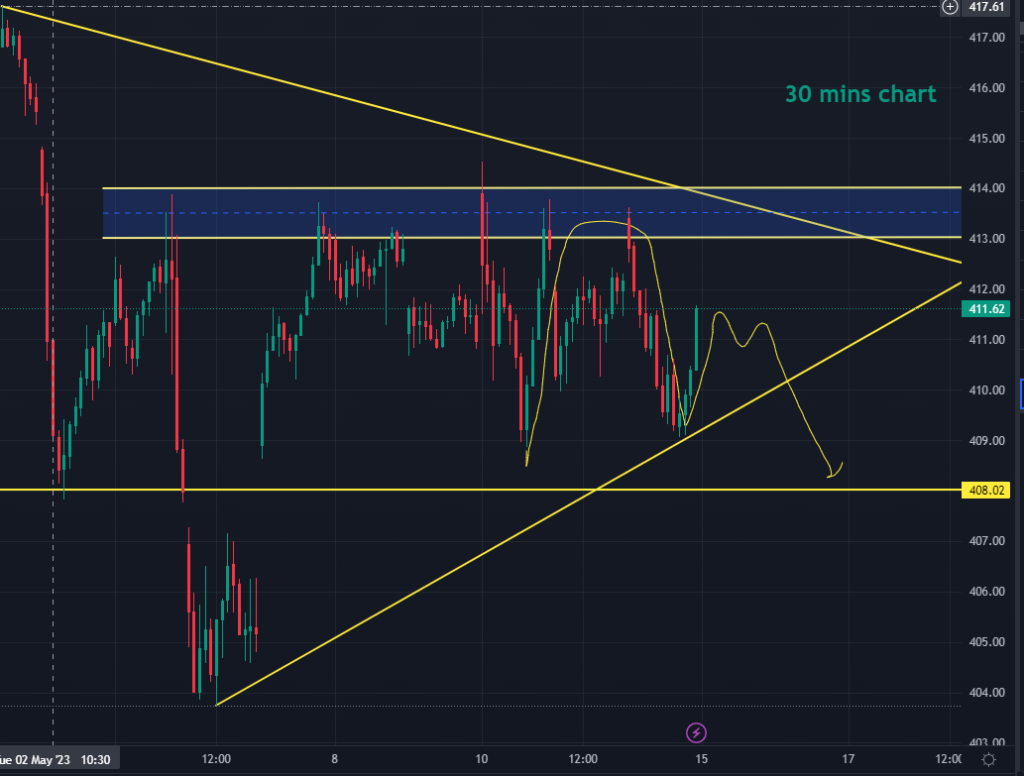
So for the week ahead, we need to observe, if we are to observe an inverse cup and handle pattern, which will bring us back to test the support line 408 again.
#4: Selling continues but with a reversal to the upside
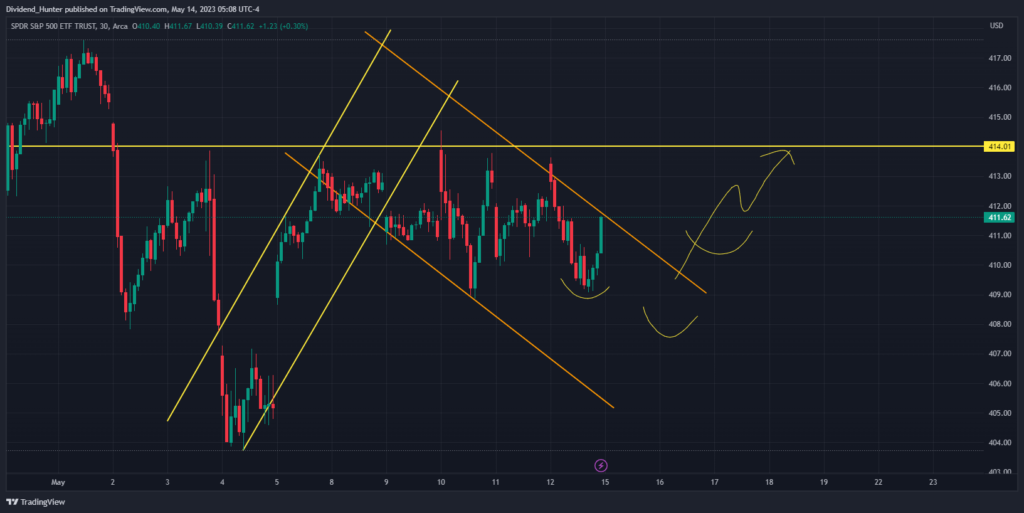
Looking at the large time frame, we observe that the orange lines have been the selling channel. It is on the verge of breaking out the upper line to signal an uptrend reversal that could lead us to 414 resistance first and, hopefully, to 420, as discussed in #2.
The yellow curves imply a critical concept. We could still see selling pressure with the cup and handle formation and rising back up. Hence, there can still be a dip before the reversal. So the idea is to let the structure speak to us, and a trader takes the highest possible trade based on the price action.
Final commentary
So the above are the 4 key ideas that you need to be aware of and keep in the rear view of your mind before you begin your trading week.
We are always looking out for 2 main things: structures and formation to better assess a high-probability trade.
It has been a pleasure sharing my thoughts with you, and I hope you find it fruitful in your trading and investing career.
With that, I shall catch up with you tomorrow.
Cheers,
Pika Nat
Follow our Socials for the latest update on our possible trades
- Instagram: @themoneynmeaning
- Telegram: https://t.me/invest_with_pika_world




More Stories
FOMC minutes in Review
FOMC shaping this week’s development
The “Hustler” thought. Are you working hard too?