It’s a sunny Sunday and in the midst of turbulent financial conditions from the fallout of SVB, there could be one trading entry method if you find it useful.
In this example, we use GOOGL as our case study. Note that this is a cherry-picked example to showcase the essence of this trading methodology. As we have seen, the market is dynamic, so we can be nimble and made variations.
Step 1: Understand the trend of the market.
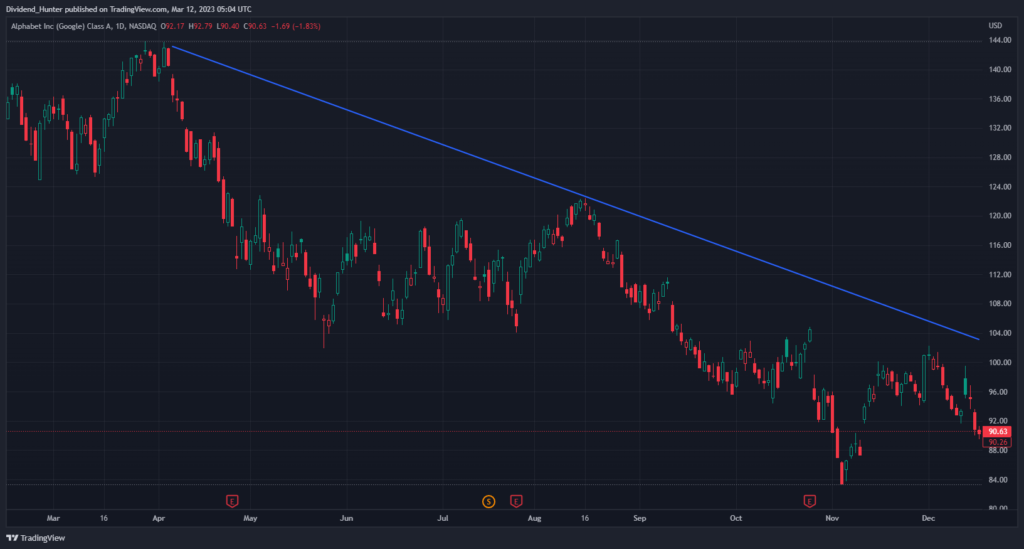
From the daily chart, we can see that it is in a downward trend. So, our target is to look for a short entry.
Step 2: Identify areas of resistance and support
The area of surrounding resistance and support provide a guide to your trade entry and exit.
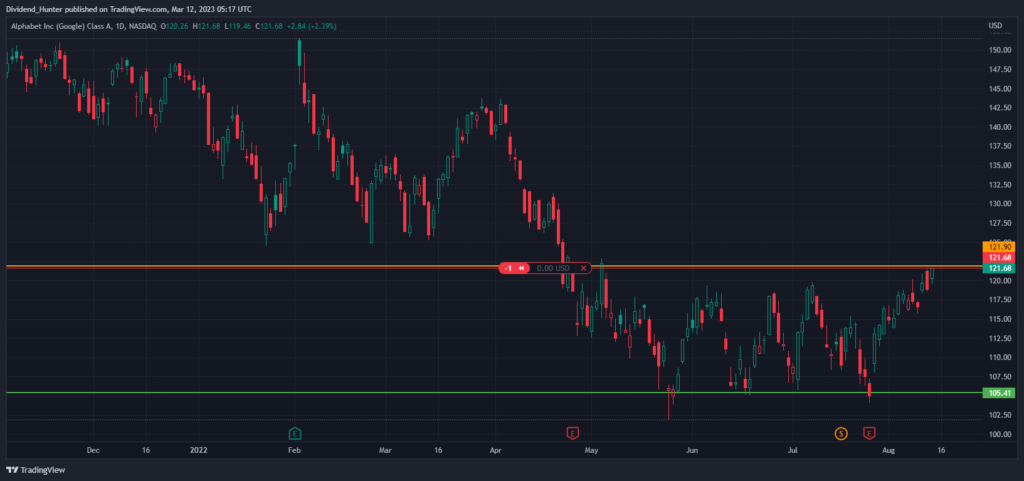
In this scenario, we have identified the resistance level on the orange level and the support level at the green line.
Step 3: Set the entry point (which is our short area)
We will be looking to sell near the resistance level say around the orange indicator of 121.68, Of course, this is a picked example, you will usually not be able to get such a perfect short entry. One possible entry rule is to enter after a bearish candle bar.
Step 4: Know your Stop Loss (SL) point
The exit points refer to your TP (take profit) area and SL (stop loss area)
Observe that the resistance level which is the orange indicator of your entry is 121.68. When choosing an SL level, you can set it at 1 ATR above this entry level. To do this, if you are using trading view, search for the indicator, ATR.
You may consider changing the setting to as follows given that there are about 22 trading days in a month. Then change the smoothing to SMA mode.

As seen below, the ATR is around 3.75. Hence the SL level will be 121.68+3.75 =125.43

Step 5: Choose your Take Profit (TP) point
Your TP level could be around the support level which is the green line in Figure 2 which is around 105.41.
Overall view of the trade: Risk-Reward Ratio

Using the function in trading view, you can map out the RR ratio by shifting the lines onto your TP and SL. In this example, the RR is 4.69 which is a good level. Usually, 1:2 is considered awesome.
So what actually happens in the subsequent trading days?
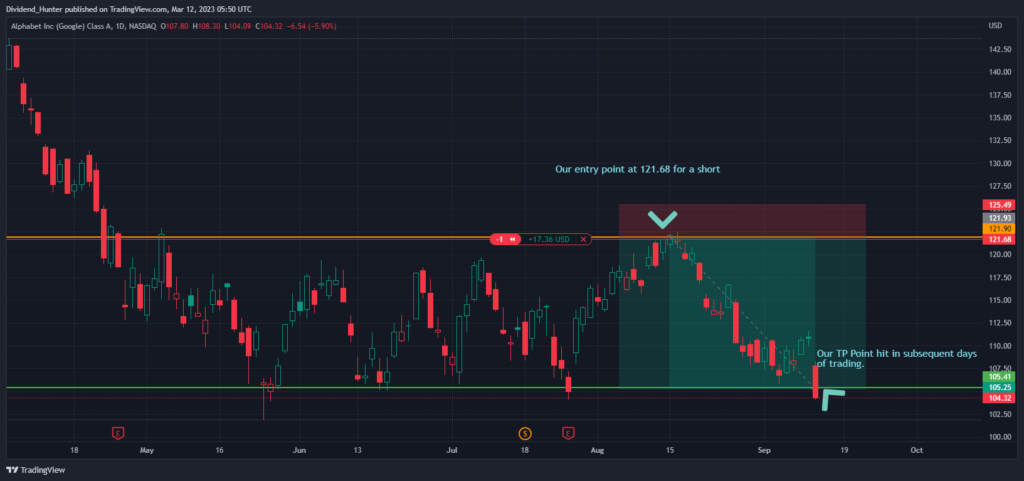
It hits our TP level and we exit from the trade.
Is this the Holy Grail of a trading system?
Well, by now, you should be aware that this is not a foolproof trading method. You will still be bound to make losses but with a definite trading methodology, it increases your odds of profitability that is reviewed by your RR ratio too.
There are also variations to this trading system. For example, a trader may not wish to TP at the support level. He/She may want to use a trailing stop. Hene there are many variations to this trading system.
Variation 1: Using Trend-Base Fibonannci Line for TP
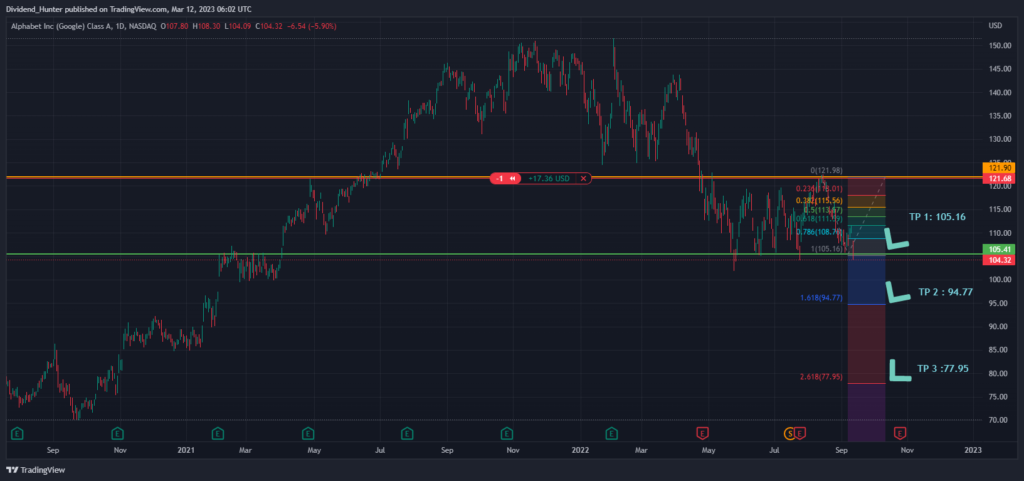
Using this method, instead of TP all your short position at 105.16, we can consider the following:
a) TP 40% of our position at 105.16
b) TP 30% of our positions at 94.77
c) TP final 30% of our position at 77.95
Should we change our SL with this variation? You could shift it to your Entry price which is 121.68 instead of 1 ATR above. This would mean at the very least, a breakeven if the stock price reversed.
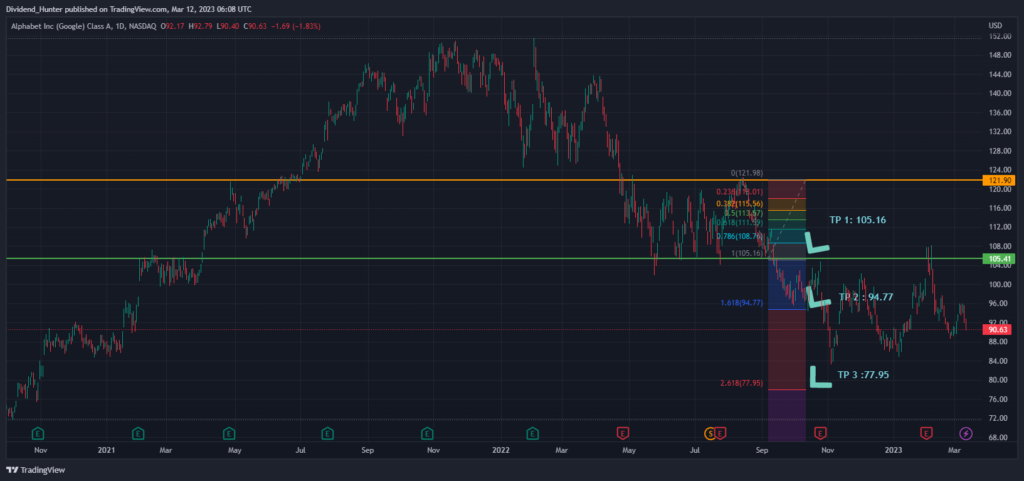
As it turned out in subsequent days, it did hit our TP 2 level but till now in March, this methodology did not hit the TP 3 as yet and the trade has not hit the SL level too. Hence, supposedly, this trade would be still navigating its way till now LOL.
Having said that, the above system is simply a guide. You could use this as a base case and add variation to your Entry Point, Take Profit and Stop Loss levels depending on your trading style. A rule-based trade increases the probability of success.
Have a splendid weekend!
From your trading buddy always.


More Stories
The “Hustler” thought. Are you working hard too?
Market update for the week of 15 May
Market update for the week of 8 May